7 Ways to Make S&P's Top-50 Community Bank List Next Year
S&P just ranked nearly 3,700 community banks. Here's what the top performers do differently and how to close the gap.
TL;DR
S&P Global's 2025 community bank rankings reveal a 15-to-20-point efficiency ratio gap between the top 50 and the median in every region. The winners aren't bigger. They're operationally tighter. This article breaks down S&P's eight scoring metrics, shows where the gap lives, and outlines seven actionable steps any community bank can take to improve the metrics that matter most.
S&P Global Market Intelligence just released its 2025 rankings of the best-performing community banks in the U.S. The analysis covered nearly 3,700 institutions across five regions. Only 250 made the top 50 in their region. Making the top 50 in any region puts a bank in rare company. But what caught our attention wasn't who made the list. It was how consistent the gap between top performers and the median turned out to be, and how much of it traces back to operational decisions rather than market conditions. The rankings aren't just a scorecard. S&P publishes the exact methodology, including the eight metrics and their weightings, which means the data tells you precisely what separates the best from the rest. And more importantly, what you can do about it. To download the report yourself click here.
The 8 Metrics That Determine the Rankings
S&P evaluates each institution across eight performance metrics, weighted to emphasize profitability and balance sheet strength:
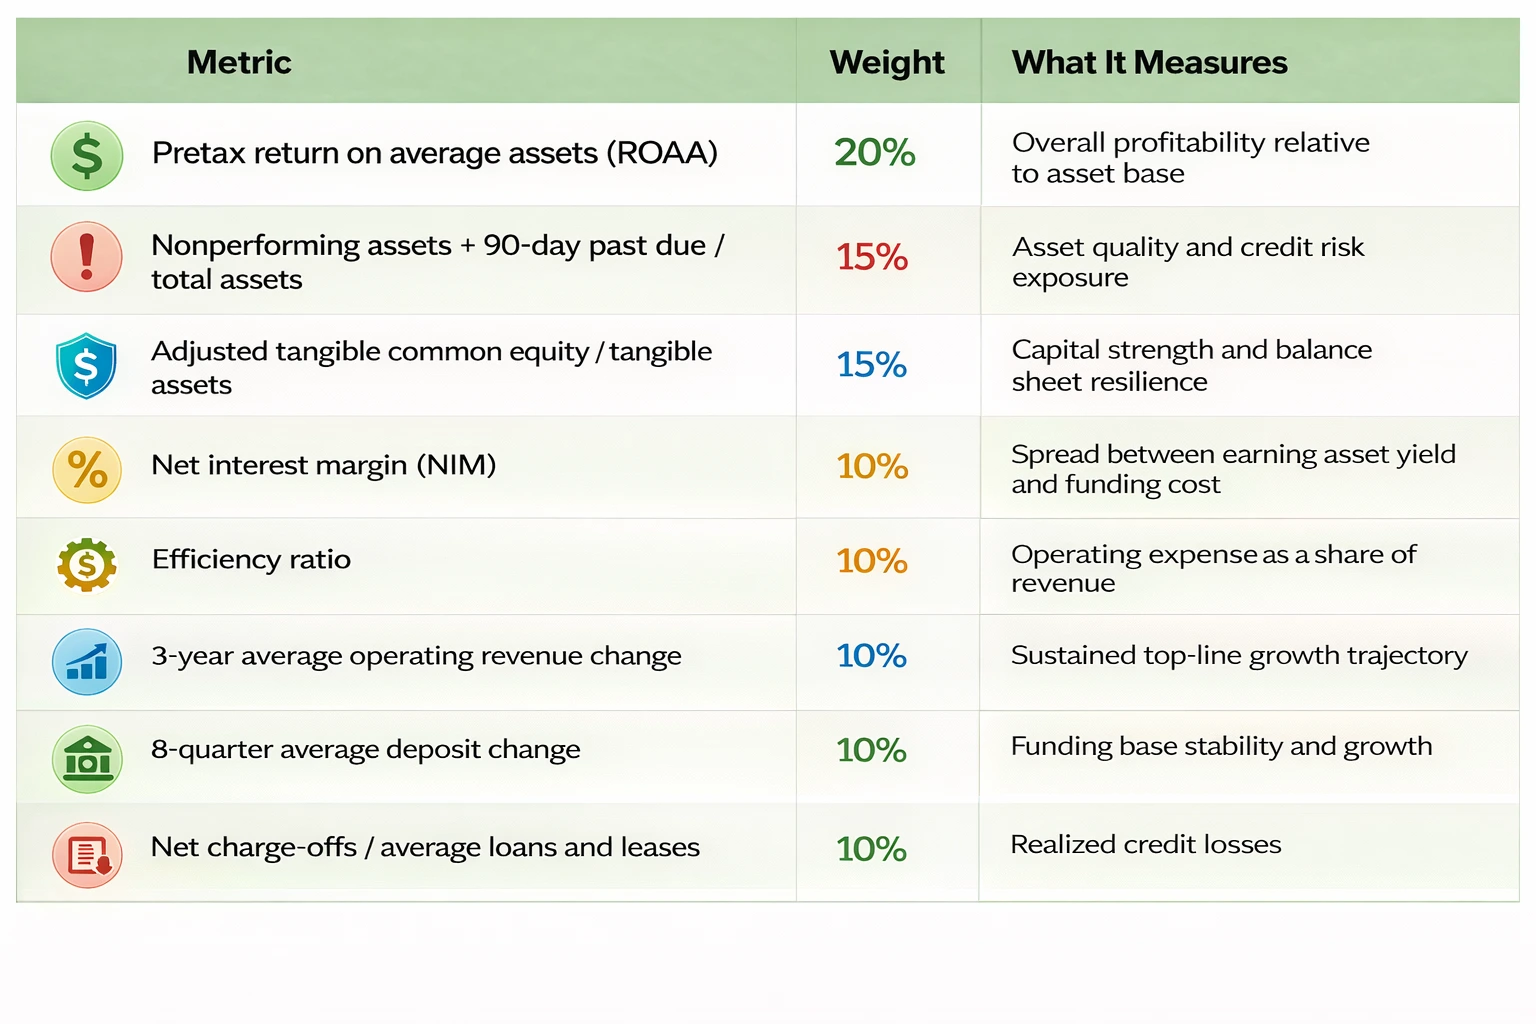
A few things jump out. The single heaviest metric is ROAA at 20%, but ROAA is a downstream outcome. It's driven by NIM, efficiency, and credit quality working together. Asset quality and capital strength together carry another 30%. And the efficiency ratio, the metric most directly tied to how a bank runs its day-to-day operations, carries 10% on its own while influencing at least three other metrics above it.
In other words, roughly 45% of the composite score is tied directly to how efficiently a bank operates. The rest reflects the results of that efficiency flowing through to profitability, capital preservation, and credit discipline.
The Gap Between the Top 50 and Everyone Else
The single clearest pattern across all five regions: the median community bank runs an efficiency ratio in the low-to-mid 60s. The top 50 run in the mid-to-high 40s. That's a 15-to-20-point gap, and it shows up everywhere:
Northeast: 20-point spread (53.4% vs. 73.4%) across 391 eligible banks, the widest of any region
Midwest: 17.5-point spread (45.8% vs. 63.3%) across 1,718 eligible banks, the largest pool analyzed
Southeast, South Central, and West: all between 14.6 and 15.5 points
That gap isn't explained by rate strategy, market geography, or asset mix. It's explained by how work gets done inside the bank. And it cascades: the top 50 posted median ROAAs of 1.99% to 2.55% across regions, roughly double the median for all eligible banks. Many of the top performers are also genuinely small. American Interstate Bank (#1 Midwest) has $134 million in assets, three branches, and a 27.8% efficiency ratio. Cumberland Security Bank (#1 Southeast) ran a 33.1% efficiency ratio with four locations. Eagle Bank (#1 West) operates a single branch.
The takeaway: scale is not the differentiator. Operational discipline is.
Here are seven actionable steps to improve the metrics S&P values most and position your bank to land on next year's list.
1. Benchmark Yourself Against the Top 50 in Your Region
Metrics addressed: All 8
You can't close a gap you haven't measured. S&P publishes the top-50 medians alongside the full-group medians for every region, giving you two reference points: what "top performer" looks like and what "average" looks like.
Start with the three metrics that carry the most weight in the composite score: pretax ROAA (20%), NPA ratio (15%), and tangible capital (15%). Then look at your efficiency ratio. If you're running above 60%, there is almost certainly 10 or more points of room to improve before you hit structural constraints.
The goal isn't to obsess over ranking methodology. It's to identify where your biggest gaps are relative to your peer group so the next six steps are aimed at the right targets.
2. Audit Your Back-Office Workflows for Hidden Cost Drag
Metrics addressed: Efficiency ratio (10%) and ROAA (20%)
The efficiency ratio gap between top performers and the median is 15 to 20 percentage points. That gap doesn't come from one expensive line item. It accumulates across dozens of back-office workflows that haven't been re-examined in years.
Loan operations are a common example. At many community banks, commercial loan packages arrive as a mix of PDFs, emails, and portal uploads. Before anyone can make a credit decision, an analyst has to manually sort documents, extract financials, and re-enter data into spreading tools and the LOS. The process is slow, inconsistent, and ties up skilled staff on work that doesn't require their expertise.
The same pattern shows up in deposit operations, reconciliation, and exception handling. Each process adds a few basis points to your efficiency ratio. Together, they add up to the gap between 48% and 63%.
Map your highest-volume, most labor-intensive workflows. Identify where your people are spending time on data assembly and manual handoffs rather than judgment and decision-making. That's where the cost drag lives.
3. Connect Your Data Before You Try to Automate It
Metrics addressed: Efficiency ratio (10%), NIM (10%), and operating revenue growth (10%)
One of the most common reasons operational improvements stall at community banks is that data sits in silos. Your core system, loan origination platform, document management, GL, and compliance tools often don't share information in a usable way. The result: your team spends hours moving data between systems instead of acting on it.
This hits the efficiency ratio directly, but it also drags on NIM and revenue growth indirectly. When your lending team waits on information that should already be available, decisions slow down. Slower decisions mean longer time-to-close, which means lost deals and compressed margins.
Before investing in new tools or automation, get a clear picture of how data flows (or doesn't) between your existing systems. The banks that perform best on these rankings aren't necessarily running the most advanced technology. They're running connected operations where information moves without manual intervention.
4. Reduce the Cost of Compliance Without Reducing the Rigor
Metrics addressed: NPAs + 90-day past due (15%), net charge-offs (10%), and efficiency ratio (10%)
Asset quality carries 25% of S&P's composite score when you combine NPAs and net charge-offs. Maintaining strong credit quality isn't just about underwriting discipline. It's about having the operational infrastructure to monitor, document, and respond early.
BSA/AML is a good example. Most community bank compliance teams work through a high volume of alerts each week, pulling transaction history, account context, and ownership information from multiple systems before a single review decision can be made. The majority of alerts turn out to be routine. But the effort to confirm that is the same for every one.
The same dynamic applies to regulatory reporting. Call Reports, HMDA, CRA, and exam prep all require assembling data from multiple sources and reconciling discrepancies before submission. When that process is manual, it's expensive, error-prone, and creates the kind of documentation gaps that show up in exam findings.
Tightening your compliance operations doesn't mean adding headcount. It means structuring the workflow so your team spends time on the exceptions that require judgment, not on assembling the data that precedes judgment.
5. Rethink Your Staffing Model Around Flexibility
Metrics addressed: Efficiency ratio (10%) and ROAA (20%)
Staffing is typically the single largest operating expense at a community bank. And most banks staff for their peak workload: loan closing surges, exam prep, seasonal deposit activity. That means carrying excess capacity most of the year.
The top-performing banks in S&P's rankings have figured out how to match capacity to demand without permanent overhead. Some do it with cross-trained teams. Others use operational partners who can scale up or down based on actual volume.
This isn't about cutting people. It's about deploying people on work that requires their expertise and finding flexible models for the operational volume that doesn't. A bank that moves from a fixed staffing model to one with variable capacity on high-volume processes can materially change its cost structure without touching service quality.
6. Strengthen Your Early-Warning Credit Infrastructure
Metrics addressed: NPAs + 90-day past due (15%) and net charge-offs (10%)
Together, asset quality metrics carry 25% of the S&P composite score. The top 50 banks across all five regions posted near-zero NPAs and net charge-offs. American Interstate Bank ran 0.00% on both. Cumberland Security Bank posted a 0.14% NPA ratio and 0.05% net charge-offs. That kind of performance isn't luck. It's the result of catching problems early, before they become past-due, before they become classified, and well before they become charge-offs.
For a COO, this means making sure your loan review and portfolio monitoring processes are structured to surface deterioration as soon as it starts, not when it hits a threshold. Are covenant exceptions tracked and escalated systematically, or do they sit in a spreadsheet until someone reviews it? Is financial statement collection automated with follow-up triggers, or does it depend on someone remembering to chase it?
The banks on these lists don't necessarily have better borrowers. They have better systems for knowing what's happening in their portfolio in real time and acting on it before the numbers get ugly.
7. Treat Operational Efficiency as a Discipline, Not a Project
Metrics addressed: 3-year operating revenue growth (10%), 8-quarter deposit growth (10%), and the full composite over time
S&P includes three-year revenue growth and eight-quarter deposit growth in the methodology for a reason. These aren't point-in-time snapshots. They reward sustained momentum. A bank that runs one cost-cutting initiative in Q3 and calls it done won't move these numbers. A bank that builds a culture of continuous operational improvement will.
American Interstate Bank didn't just make the top-50 Midwest list in 2025. It made it for the second consecutive year. NorthEast Community Bank has topped the Northeast ranking two years running. Cumberland Security Bank moved from #2 in the Southeast in 2024 to #1 in 2025.
These banks treat operational efficiency the way they treat credit discipline: as a permanent part of how they run the institution, not a special initiative with a start and end date. They continuously audit workflows, challenge cost assumptions, and invest in the infrastructure (people, process, and technology) that lets them do more with less, year after year.
Where Do You Stand?
S&P's rankings are based on financials for the year ended December 31, 2025. The window to influence next year's list is open right now. The seven steps above map directly to the metrics S&P uses to evaluate performance and to the operational patterns that separate the top 50 from the other 3,400+ community banks in the analysis. But knowing what to improve and knowing where to start are two different things.
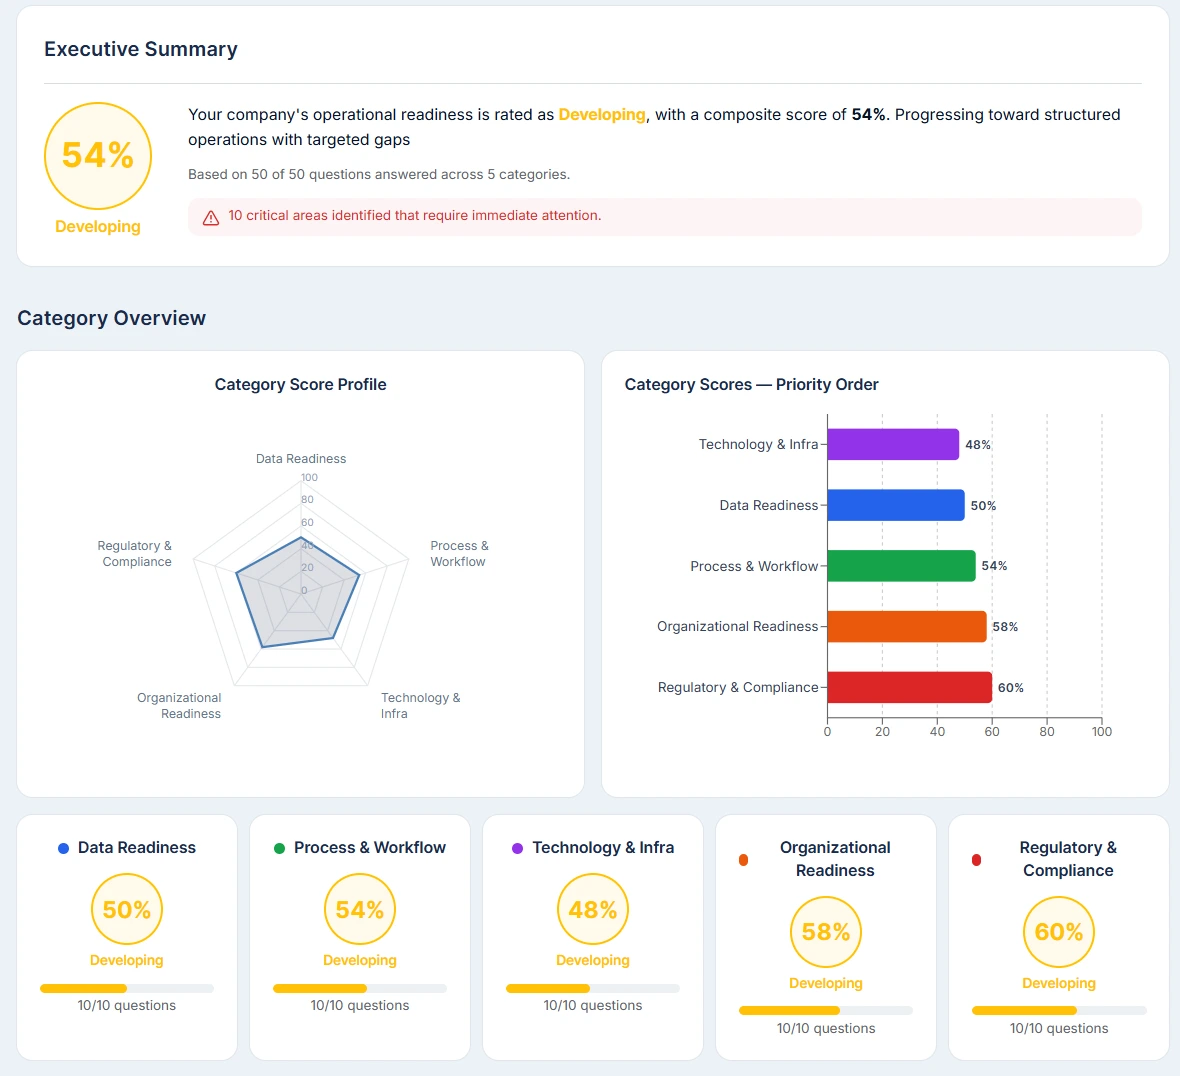
This is why Shore Group developed the CORE Assessment. It's a free, confidential self-assessment for community bank leaders that scores your institution's operational readiness across five categories: data readiness, process and workflow maturity, technology and infrastructure, regulatory compliance posture, and organizational alignment. You'll walk away with a prioritized gap analysis and actionable recommendations you can bring to your next board meeting.
No obligation. Just a clear-eyed look at where you have the most room to move. Our mission is to help community banks and small businesses compete against large institutions with billion dollar budgets. Learn more about the CORE Assessment and see if it's a good fit for your bank.
Take the AssessmentSample Report from CORE Comprehensive Assessment.